
dragon.PDA · Data Acquisition & PLC Archiving
Capture measurement data.
See connections.
Understand processes.
dragon.PDA archives your PLC data and enables graphical analysis of measurement values. Combine sensors, compare trends, and access historical data – in a single, centralized application.
Discover features- Multi-PLC support.
- Up to 10 measurement series.
- Historical analysis.
From control to analysis.
Your data. Your overview.
Connect measurement points.
Identify trends.
Flexible sensor selection and extensive visualization options help you examine the relationships between measurement points. The available archiving period depends on the available storage space.
Collect PLC data centrally
A Windows service communicates directly with the PLC and stores the data centrally. The application supports multiple PLC systems and user-defined storage intervals for each unit.
Trace trends
Access archived measurement values and precisely define the desired time period. Normal and History modes support different types of analysis.
Compare sensors
Combine up to ten data series or sensors in a single graphical analysis. Measurement data can be displayed exactly or via interpolation.
Analyze Mass Data
Examine large volumes of data in the dragon.PDA grid and export results to Excel, Word, or PDF.
From individual measurements to the big picture – configurable, comparable, and traceable.
01 / Home
Get started right away.
Work your way.
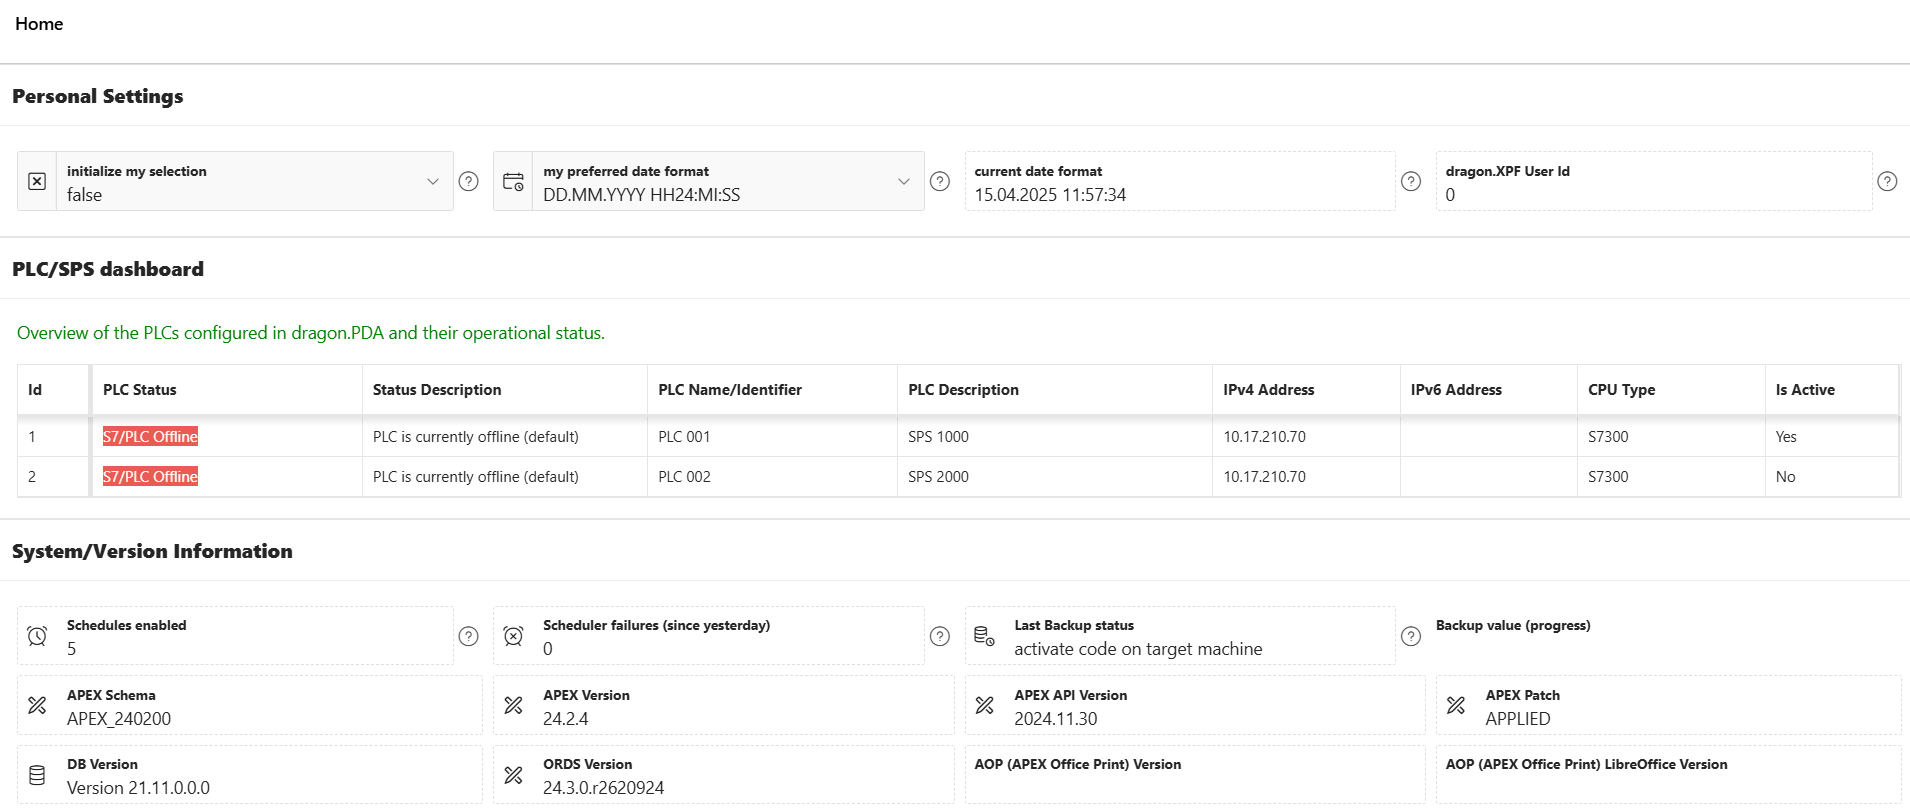
After logging in, you see the connected PLC systems and set your personal preferences. These include date formatting and retaining your sensor selection from the previous session.
Visual settings are saved on a per-user basis. Context-sensitive help for specific fields and an embedded PDF help document support operation.tion.
02 / Cockpit
The right sensors.
In the right context.
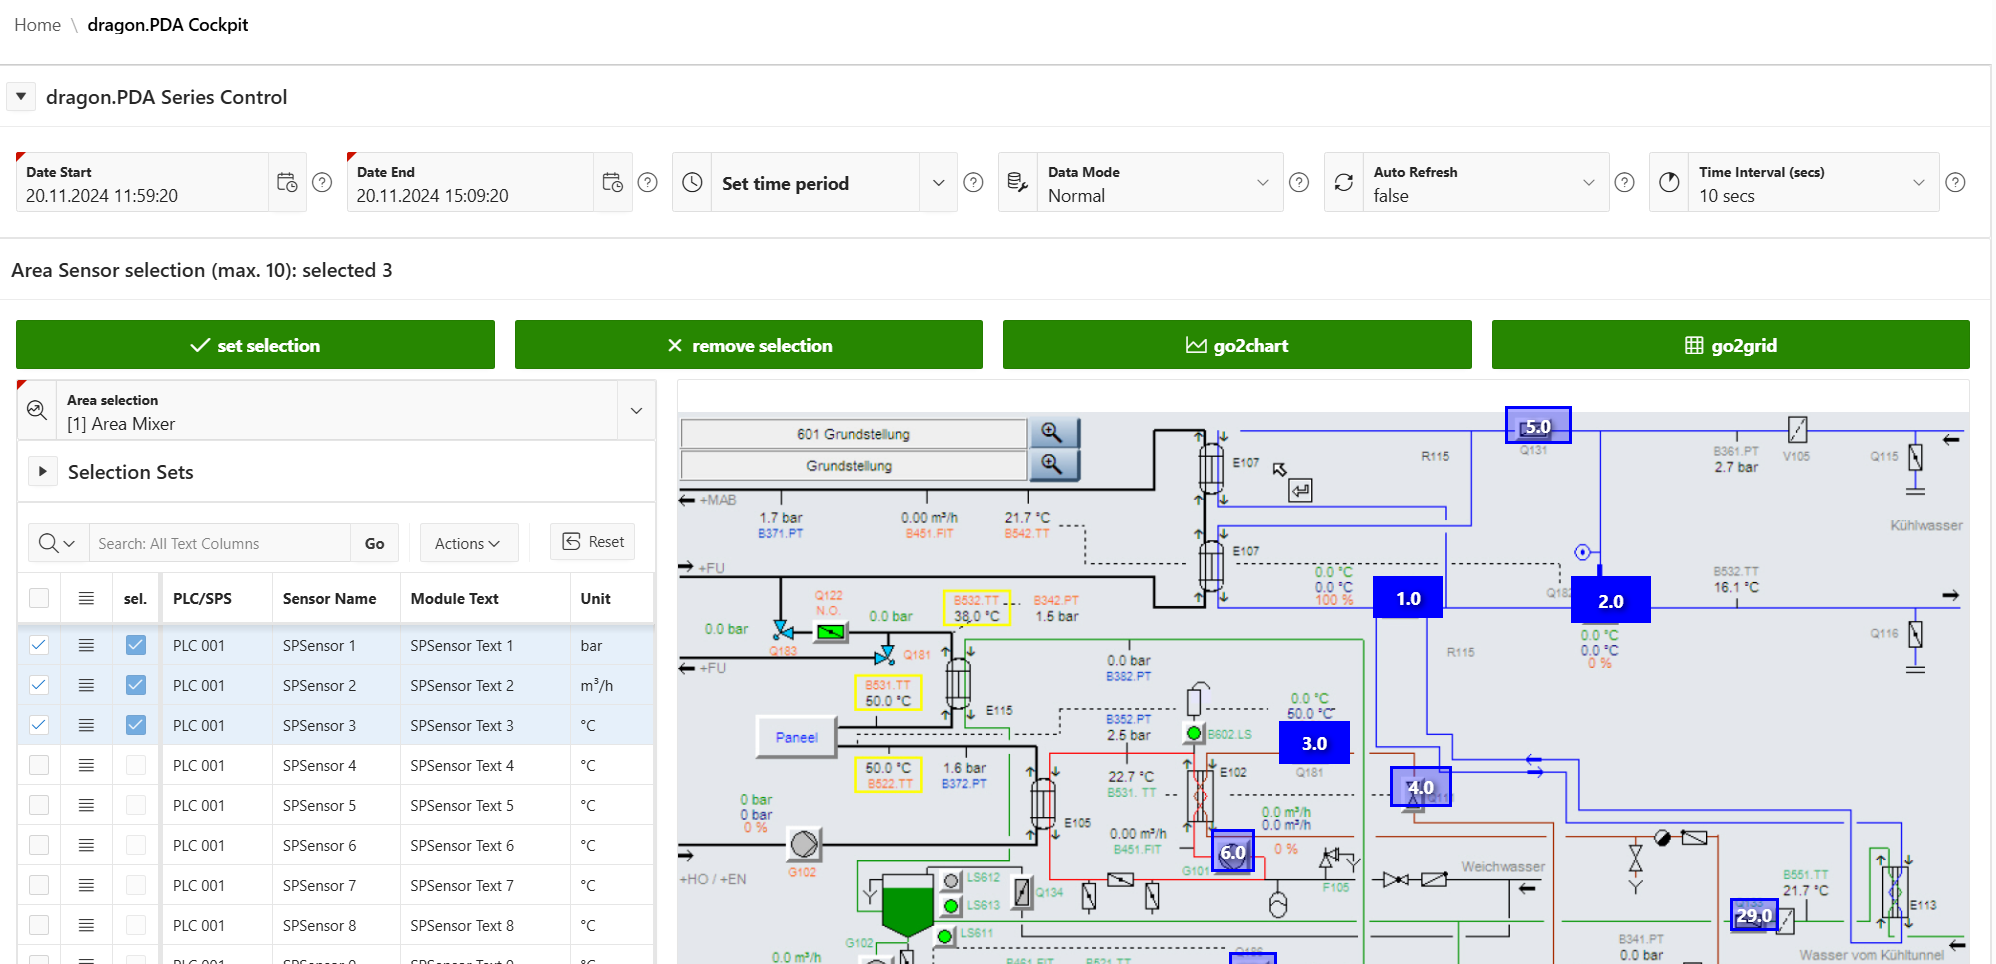
Use Series Control to define the time period and data mode. Save your sensor selection as a selection set and display measurement points in the context of the system.
Selection Sets
Compile the desired sensors and save the selection for recurring analyses.
Sensor Positions
Visualize the positions of the sensors within your system. Sensors and areas are freely configurable and can be linked to a schematic diagram.
Area Editor
Customize the appearance of the sensors on the system layout.
03 / Chart & Analysis
Visualize data trends.
Examine specific details.
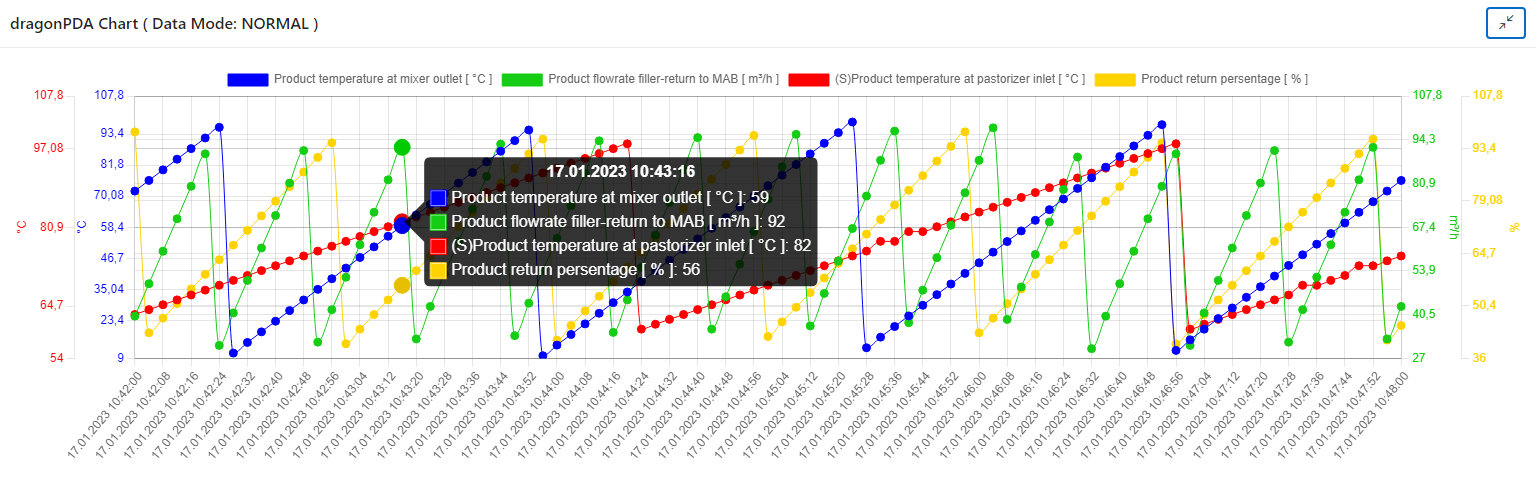
Up to 10 data series.Precise or interpolated display.
- 01 / Refresh
Auto-Refresh
Automatically refresh the display at intervals of 5, 10, 30, or 60 seconds.
- 02 / Detail View
Chart Zoom
Activate the zoom function to examine relevant sections of a data trend in greater detail.
- 03 / Orientation
On-Demand Tooltips
Customize tooltips – …such as font size and positioning.
- 04 / Display
Configurable lines
Select the color, width, and other visual characteristics of the chart lines.
- 05 / Workspace
Flexible chart height
Adjust the display height to suit different screen resolutions.
- 06 / Overview
Axes and legends
Show or hide Y-axes and legends to match the current analysis.
04 / Configuration & Operation
Configure centrally.
Administer precisely.
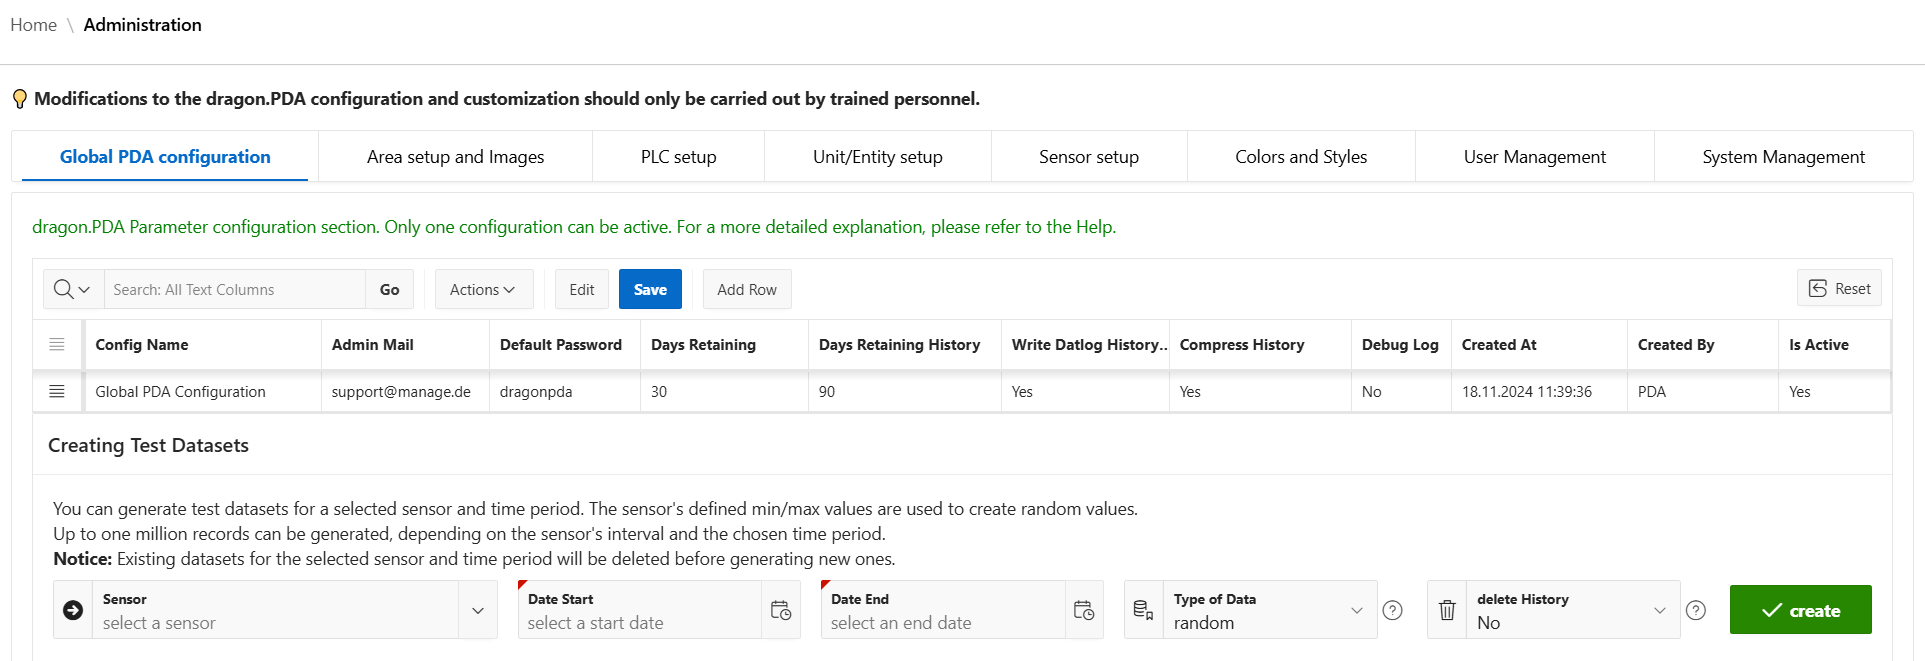
Central data block assignments are set up in the administration area during initial configuration. All relevant data acquisition parameters can be defined via authorized administrative access.
Freely selectable storage intervals per unit, comprehensive logging analyses, and user management with role assignment support largely autonomous operation.
For aut…authentication and authorization, the free dragon.XPF is used. Multiple PLC systems from the S7-300 to S7-1500 series are supported.
The interface is responsive and automatically saves field changes. The data grid is excluded from both functions.
Optional Add-ons
Expand to fit.
Tailored to your needs.
Enhance dragon.PDA with features for data backup, pre-configured systems, and regular reports.
Automatic Backup
Automatic backup including Oracle database and log archive management.
dragon.PDA Appliance
Fully pre-configured systems as a manage.it dragon.PDA appliance.
Regular Reports
Weekly, monthly, and annual reports in PDF, DOC, and RTF.
Your next step
Get more out of your
PLC data.
Do you want to archive measurement data, analyze sensor trends, or consolidate multiple PLC systems? Discuss your requirements with us.
Get a consultation on dragon.PDASchertlinstr. 39
86159 Augsburg, Germany